#Occupydata Hackathon 2 Roundup

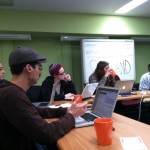
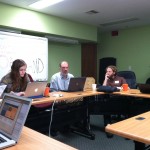
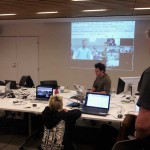
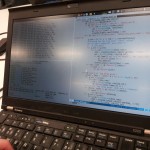
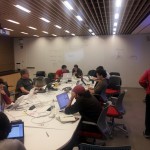
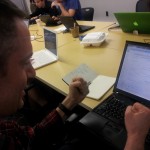
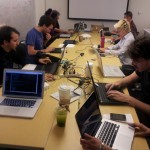
In 5 cities (Boston, Los Angeles, New York, Oakland, DC) over 3 days (Mar 23, 24, and 25), developers, designers, researchers, artists, occupiers, and hackers gathered to analyze and visualize datasets related to the Occupy movement. At the various sites, teams of people worked on separate projects, with the goal of using free and open source tools to creatively present data pertinent to the Occupy movement and the issues it has raised. Hackathon participants created a range of exploratory visualizations, including artistic word clouds (#OccupyData Mural, State and Space), bubble charts, phrase nets, maps, tumblr blogs combining data and photos, and faceted data browsing tools.  The sites remained in real-time communication throughout the Hackathon, networked via video chat, IRC, and collaborative documents.
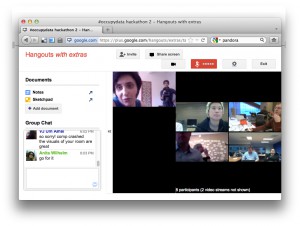
screenshot

Data sets

One major focus was the Occupy Research General Demographic and Political Participation Survey (ORGS), which aimed to gather information about the demographics of Occupiers as well as about various forms of civic and political participation in the Occupy movement. The survey was designed through a transparent and collaborative process that included Occupiers and researchers from across the globe.

The survey was conducted by the Occupy Research Network (http://occupyresearch.net), which includes academics, activists, students, community researchers, and others, with support from DataCenter (http://www.datacenter.org). A list of people involved in the ORGS survey is available at http://occupyresearch.wikispaces.com/surveys#People.

ocw-youtubevideo

To explore questions about issues of interest to the movement, hackathon participants worked with publicly available data sets as well as social media data gathered by scraping information from sites like Twitter (State and Space), online news sources, and media sharing platforms like Youtube (Occupy Video as Data: Visualizing Temporal Narratives).


Hacked!

Faceted Browsing
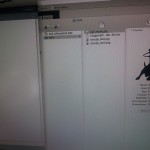
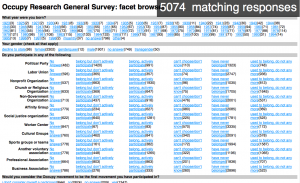
Occupy Research has made the ORGS survey data available in many formats for analysis and remixing. In order to make the data accessible to more people who might be interested in exploring the survey’s findings, one group created a faceted navigation interface.

http://orgs-facet.tirl.org/exhibit.html
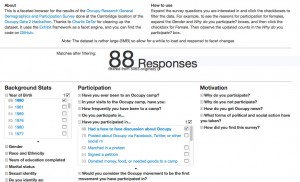
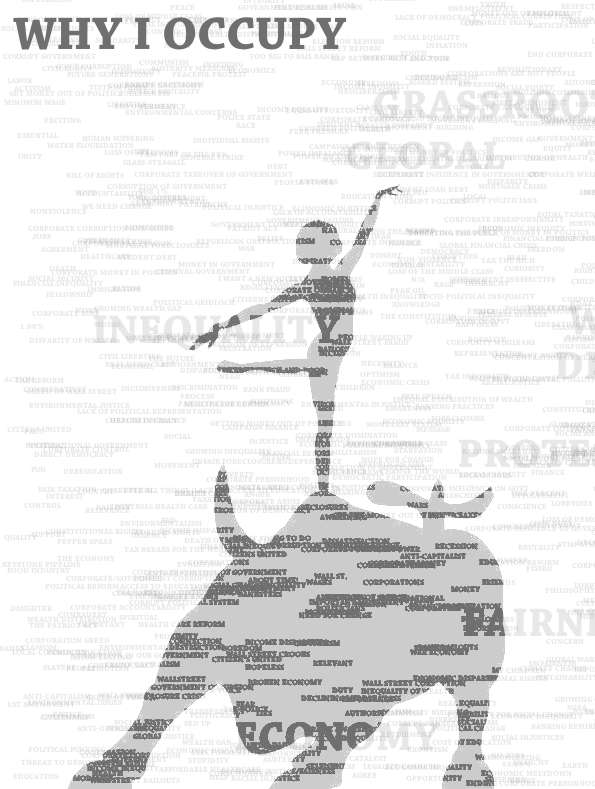
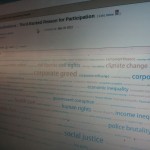
facets


Text Mural
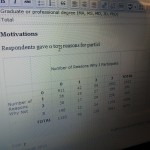
This mural draws from survey respondents’ answers to the question “If you participate in the Occupy movement, what TOP THREE concerns motivate you TO PARTICIPATE?” — the larger the word, the more it was used in people’s survey responses.  This is a collaboration between Nadia Afghani and Gilad Lotan.Screen-shot-2012-03-24-at-5.18.13-PM1


State and Space

Also blending text and imagery, this project uses the web service Topsy and a Ruby script to search for tweets that document police misconduct or benevolence, can be traced back to a specific officer, and are related to Occupy events. After cleaning the tweets of web noise, e.g. http://, the project visualizes the prominence of particular keywords associated with police misconduct. As a balancing counterpoint, the project team is also searching for keywords associated with positive instances of police behavior.
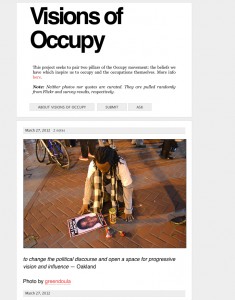
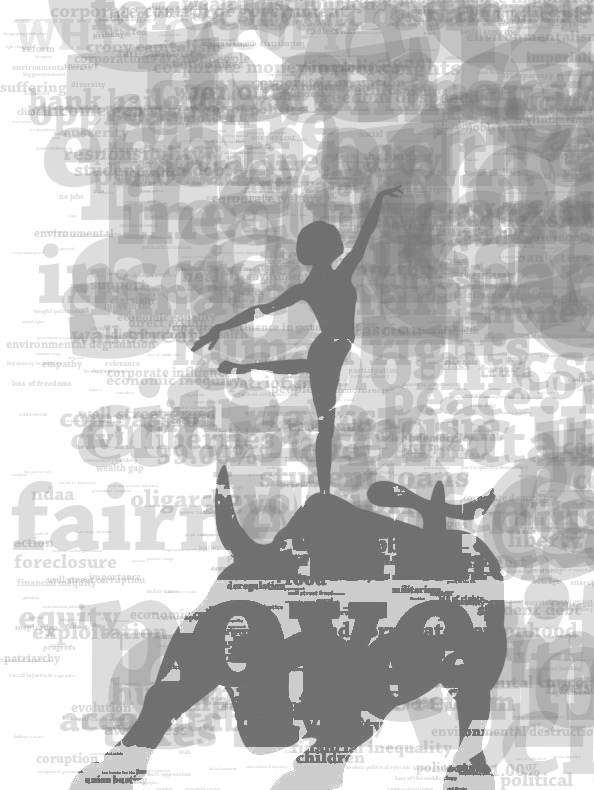
fist3p

Visions of Occupy
This project seeks to creatively juxtapose the beliefs we have which inspire us to occupy, and visual traces of the physical occupations themselves.

Using data collected this winter by the Occupy Research General Survey (administered by OccupyResearch), we take the answer to question 42—”In just a few words, what are you trying to achieve with your participation in the Occupy movement”—and pair it with a Flickr photo tagged with the camp name that the same respondent mentions. This means that while the photo displayed and quote may be completely unrelated (both in source and in specific content), viewers are presented with locational context and imagery.visionsof

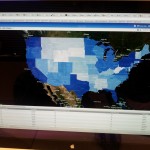
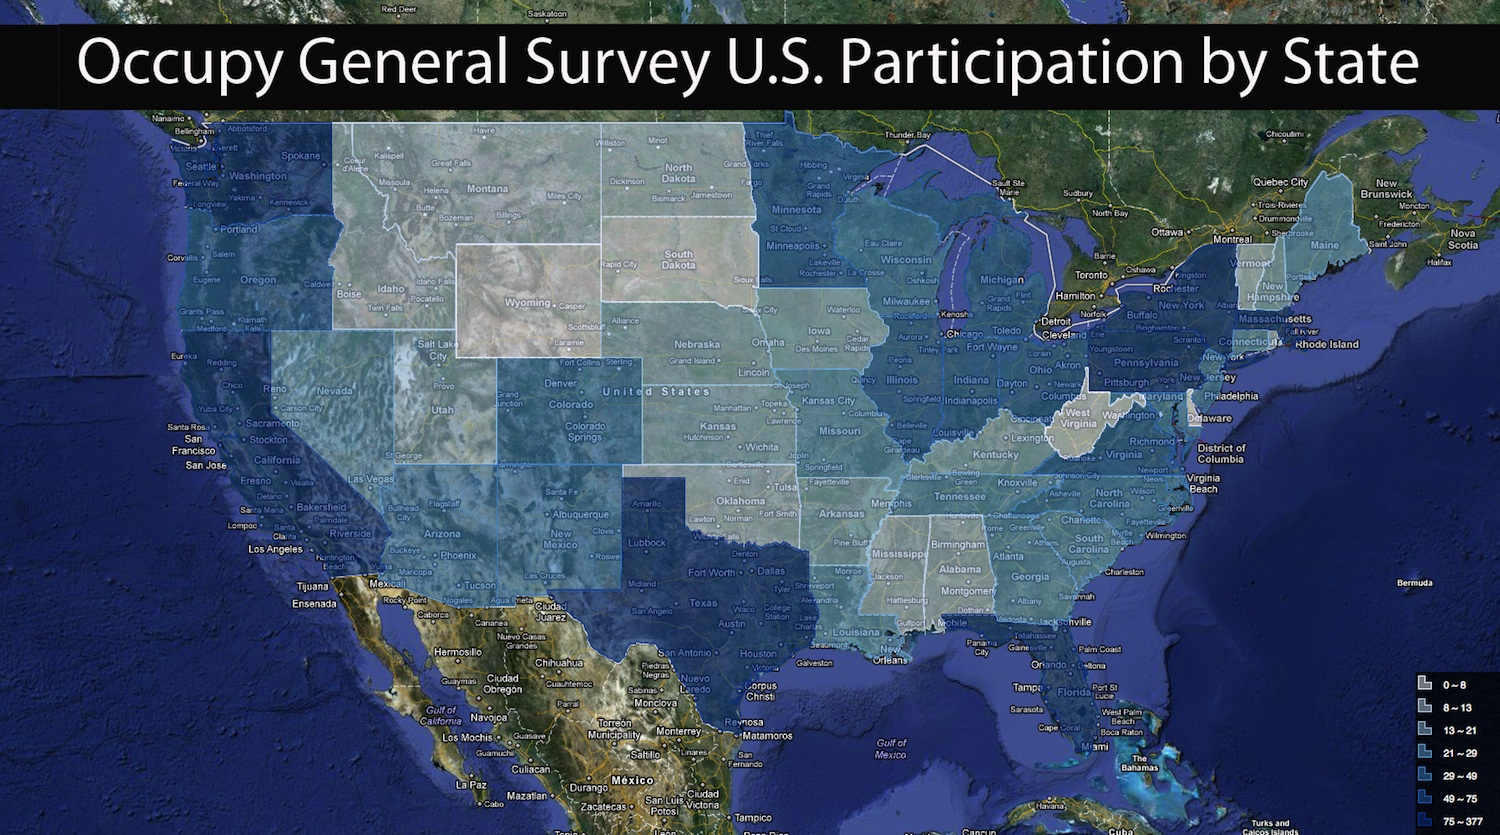
Displaying ORGS survey results by State (by quantile)
Map by Don Blair and Chris Schweidler, using GeoCommons.ogsusparticipationbystate

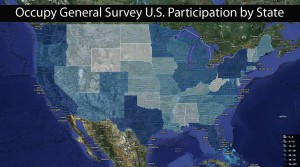
Exploring the Civic Anatomy of Occupy
According to the  Occupy Research General Survey (ORGS), OWS sympathizers and participants are among the most civically engaged individuals of the U.S. population, they possess an active voting record, and tend to be involved in a wide range of organizations and civic actions.  The ORGS allows us to explore some of the characteristics of the diverse “civic cultures” of online sympathizers who have brought broad support to OWS in the U.S.Organizational-Affiliation_Non-Participants1


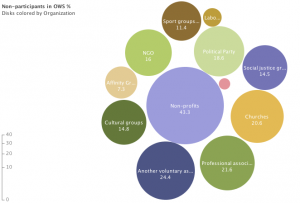
Visualizing “Phrase Nets” using Many Eyes
Also using Many Eyes, this is a visualization of answers to the question “What is your top reason for participating in the Occupy Movemment” in which the most commonly occuring terms appear larger.participation2


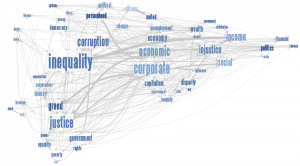
Overall the second #OccupyData hackathon was a success, with more participants than the first round, many creative explorations and demos of new data visualization possibilities, and a strong desire by participants to continue developing shared, distributed, free and open approaches to social movement based research.

PICTURES: Occupy Oakland Hackathon 2


Trying to extract demographic data from twitter

participants

June Po and Renan Escalante joined us for the afternoon of the second day. They were trying to get demographic data from twitter feeds, specifically the r-shief #f29 dataset, initially by looking for keywords that could be linked to race/ethnicity. For example, they began by looking  for “Black,” but found that this approach mostly returned false positives (eg Blackberry). Their next step was to try and look for co-occurence of ‘race’ and ‘Black,’ but that didn’t work either. The third approach they tried was to look for hashtags with terms related to race, but that didn’t produce many results either. In the future they’re thinking about other approaches: for example looking at twitter usernames, looking at RT networks, and so on.

#OccupyData Mural

This is a visual representation of people’s answer to the OccupyResearch survey question:

If you participate in the Occupy movement, what TOP THREE concerns motivate you TO PARTICIPATE?

The larger the word, the more people from the survey responded with it. This is a processing app that will ideally be both animated and interactive. Next steps are to make a smarter text layout so that more of the responses are legible.

A bunch of visual explorations from today can be found here.

This is a collaboration between Nadia Afghani and Gilad Lotan.

Screen-shot-2012-03-24-at-5.18.13-PM

An older version:

6865834654_5b5c1165a8_b

Photos from #occupydata hackathon 2, day 2

Photos from #occupydata hackathon 2, day 1

Occupy General Survey Participation in the U.S., by State (by quantile)

ogsusparticipationbystate

Based upon self-reported ZIP codes of residents, states with the highest survey participation included:
California, New York, Massachusetts, Pennsylvania, Florida, Texas and Washington.

Map by Don Blair and Chris Schweidler, using GeoCommons.

Link to this data: http://geocommons.com/maps/152629


Faceted Browsing of ORGS Data

This team cleaned up the ORGS data set for use in the visualization, collapsing into a nested data structure and converting to JSON and removing any data not used for visualization.

Current version: http://orgs-facet.tirl.org

About
This is two different interfaces for faceted browsing of the results of the Occupy Research General Demographics and Participation Survey done at the Cambridge location of the Occupy Data 2 Hackathon. Thanks to Charlie DeTar for cleaning up the dataset.

The “simple” version:orgs-facet


The Exhibit version:

 Code for both is on GitHub.

Putting ORGS Data to Work – facilitating interoperability

Another team at the Boston Hackathon is using answers to the open ended, Question 42, “What are you trying to achieve with your participation in the Occupy Movement,” to mine the answers for commonly used language in order to source categories to organize information on Tech Ops.  The goal is to take make the categorization more intuitive, using common language from the 5k+ respondents to the survey.

OWS Tech Ops has been working to create the news aggregator at Newswire.Occupy.Net and the wiki at Occupy.net (http://wiki.occupy.net).

Occupiers are adding content to the wiki and a set of folks have been organizing it, adding categorization and structure.  Using the language of the survey respondents, this team will harmonize existing categories (created by the wiki team) with the language sourced from the much larger set of 5k+ respondents to ORGS.

wiki

Wiki http://wiki.occupy.net

The news aggregator currently pulls RSS feeds from occupation sites:

    http://newswire.occupy.net/

http://newswire.occupy.net/

The team will try to use some of the same categorization for this site to make it more navigable.

Visions of Occupy

This project seeks to pair two pillars of the Occupy movement: the beliefs we have which inspire us to occupy and the occupations themselves.
Using data collected this winter by the Occupy Research General Survey (administered by OccupyResearch), we take the answer to question 42—”In just a few words, what are you trying to achieve with your participation in the Occupy movement”—and pair it with a Flickr photo tagged with the camp name that the same respondent mentions. This means that while the photo displayed and quote may be completely unrelated (both in source and in specific content), viewers are presented with locational context and imagery.