Category: visualization

Metameme: Pepper Spray Cop Mosaic


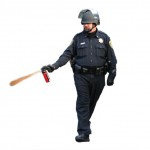
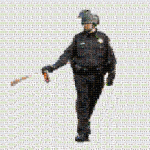
What could possible be more awesome than an #OccupyData hackathon? That’s right: the Casually Pepper Spray Everything Cop meme.

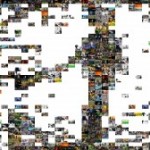
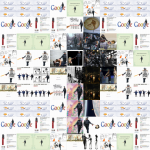
And what could be more awesome than a meme? That’s right: a metameme. One of our goals over the last couple of days has been to create just such a metameme. The basic idea is to start by generating a mosaic image of the Pepper Spraying Cop, composed of many tiny remixed Pepper Spraying Cop images. From our initial drawing on the whiteboard, we moved to start thinking about how to do a rapid implementation.

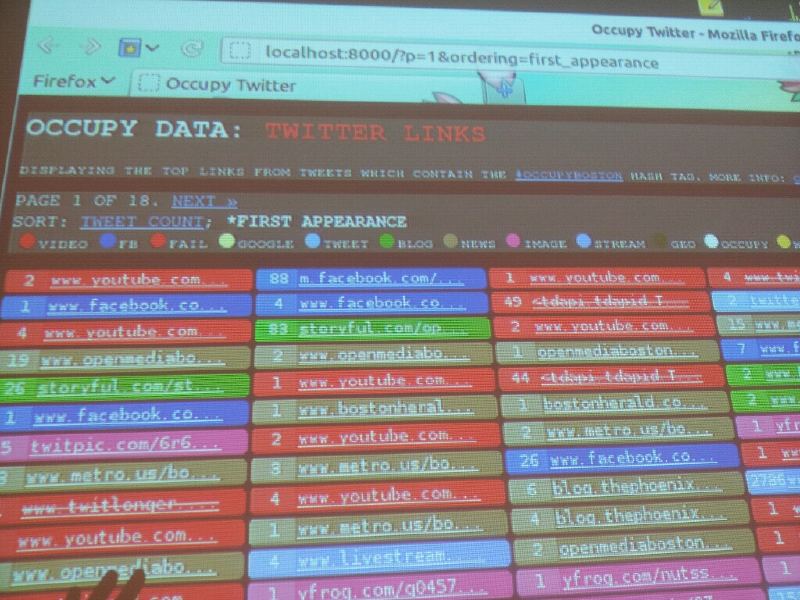
See http://brownbag.me:9001/p/pepperspraymosaic to follow the development

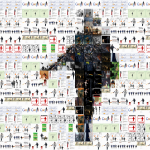
Update: [10.12.11 16.22] ET The game continues. Here some iterations from @numeroteca with metapixel:

Last iteration:

Third iteration with metapixel

The how to guide and steps:

Continue reading »

Occupy LinkViz first steps

The code: https://github.com/yourcelf/occupydatatweets/
Update: Dec 30, 2011 now with all the tweets http://alltheurls.tirl.org/
Update: Dec 12, 2011 you can check the first online mock up with the #occupyboston tweets http://occupybostonlinks.tirl.org

At the Media Lab, after brainstorming various possible projects for the #OccupyData hackathon, we decided to focus on visualizing links sent around via tweets. The following video describes this idea further:

And here’s a picture of the concept from the whiteboard:

twitter links color map

We finished the second night with a working implementation! Screenshot here:

ikytv

Explained:

Source: http://www.ustream.tv/embed/9919272

And here’s the etherpad where we’re documenting the solution:

Continue reading »

Charlie DeTar on Occupy Streams Map

Video source http://www.ustream.tv/embed/recorded/19034432

One interesting aspect of the Occupy movement has been the widespread use of live streaming to document the camps, actions, and mobilizations in real time using computers, webcams, and cameraphones. On October 24th, I ran across the Occupy Streams site that provides a list of links to all of the livestreams run by Occupiers. I forwarded a link to the site to the general email list used by researchers at the Center for Civic Media:

>> On 10/24/2011 10:36 PM, Sasha Costanza-Chock wrote:
>> Someone make a map, with thumbnails, already 🙂
>> http://occupystreams.org/>>
>> schock

By the next morning, I found this reply in my inbox:

>> > On Tue, Oct 25, 2011 at 7:25 AM, Charlie DeTar wrote:
> ok.
> http://web.media.mit.edu/~cfd/occupystreamsmap/
> http://github.com/yourcelf/occupystreamsmap/
>> -charllie

Later, Charlie DeTar wrote a blog post describing the map that he created. Today, during the #OccupyData hackathon, CDT gave us a more detailed overview of the process he used to code the map. The video at the beginning of this post is a full recording of that overview, shot by Pablo Rey Mazon. Check it out!

Key Links


Continue reading »