Category: occupydata

#OccupyData Hackathon 2

odlogo1

#OccupyData Hackathon 2: Data Visualization for the 99%!

OccupyResearchDataCenterR-Shief.org, and the MIT Center for Civic Media are excited to announce OccupyData Hackathon Round II! Join us at the locations below or organize your own.

When: March 23-24, 2012

Where: Cambridge | Los Angeles | San Francisco | Oakland | Utrech | NYC | CyBeRspace | irc.lc.freenode/occupydata | SIGN UP HERE:  http://bit.ly/occupydatavizmarchhackathon | *ADD YOUR LOCATION*

What:

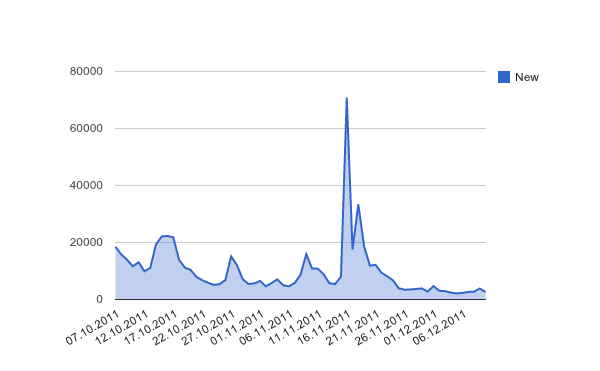
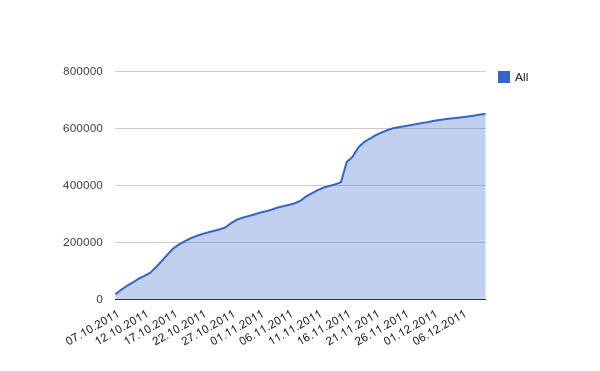
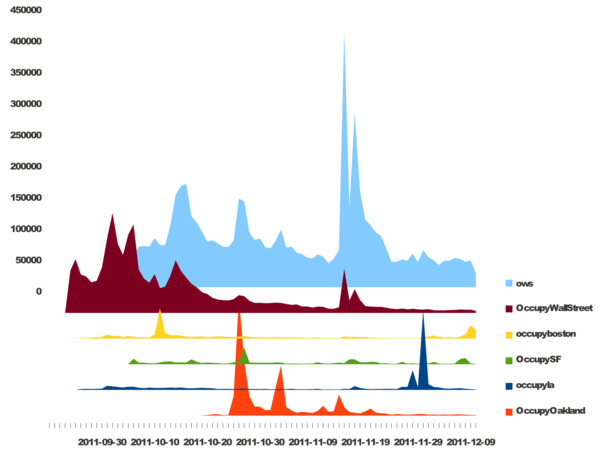
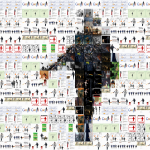
#OccupyData Hackathon 1 brought you visualizations of 13 million occupy tweets (see summaries by OccupyResearch, R-Shief, Fast Company, and Utrecht University). People participated from Utrech, LA, Boston, NY, and Spain.

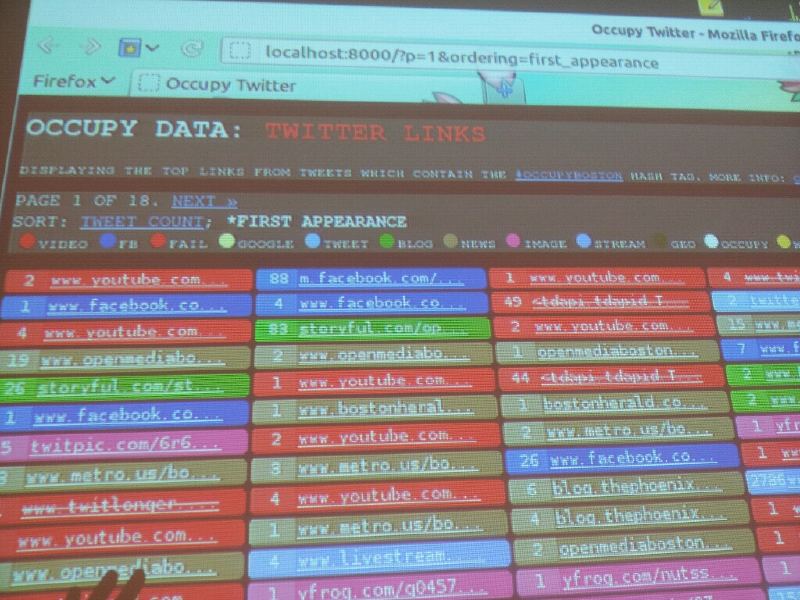
#OccupyData Hackathon 2 builds on the demos and tools from the first round, and turns our collaborative energy on visualizing the 5000+ responses to the OccupyResearch General Demographics and Participation Survey (ORGS), R-Shief Twitter #occupy tags aggregated since September 2011, and Occupy Oakland Serves the People survey, as well as other datasets people might want to explore. This event is not only for hackers or coders, but for anyone who’s interested. Bring your ideas, skills, creativity, questions and critical perspectives as we explore occupy datasets using free and open source tools and software. We’ll make connections from one place to another – open to all participants! The model is for people to arrange local venues for f2f meetups, work locally, and share/collaborate real time via skype/chat/twitter/google docs and etherpads, etc. If you can’t make it to one of the physical locations, you can still join in remotely.

How: Sign up here to a particular location! Or organize a local space and add it to the list.

Location Details: http://bit.ly/occupydatavizmarchhackathon

More info and coordination: http://bit.ly/occupyhackathon


Another #Occupy Timeline Visualization

@RyanneTKD posted this one from Team Utrecht:

Number of #OWS Participants in Twitter

The dataset with #ows hashtag contains approximately 5.3 million tweets contributed by 650K users between October 2011 and December 2011. The following graph shows the number of new users who posted a tweet on a given day (i.e., the users who hadn’t posted before that day):
oimg

The graph of the cumulative number of new users (i.e., number of unique users who had posted up until the given day) is below.

oimg2

The final dataset and charts are here: https://docs.google.com/spreadsheet/ccc?key=0Ash6mAvb0VyZdER3RDFaY0JFNlVWMnlqQXZGSExaRVE


Continue reading »

Occupy Hashtag Timeline Visualization

This project is basically a free/libre open source implementation of trendistic. We started with the following sketch of Tweet volume by city, displayed in parallel:

Timelines by City

AgU31AkCQAAEJ-l

From there, Pablo used inkscape and libreoffice to create the following static mock-up, using the real data from the #OccupyData dataset from r-shief.org

(image pulled from @numeroteca‘s post at https://twitter.com/#!/numeroteca/status/145583946778951680/photo/1)

https://twitter.com/numeroteca/status/145583946778951680/

You can follow our development process on the project’s etherpad below: http://brownbag.me:9001/p/occupyhashtagtimeline

Continue reading »

Metameme: Pepper Spray Cop Mosaic


What could possible be more awesome than an #OccupyData hackathon? That’s right: the Casually Pepper Spray Everything Cop meme.

And what could be more awesome than a meme? That’s right: a metameme. One of our goals over the last couple of days has been to create just such a metameme. The basic idea is to start by generating a mosaic image of the Pepper Spraying Cop, composed of many tiny remixed Pepper Spraying Cop images. From our initial drawing on the whiteboard, we moved to start thinking about how to do a rapid implementation.

See http://brownbag.me:9001/p/pepperspraymosaic to follow the development

Update: [10.12.11 16.22] ET The game continues. Here some iterations from @numeroteca with metapixel:

Last iteration:

Third iteration with metapixel

The how to guide and steps:

Continue reading »

Occupy LinkViz first steps

The code: https://github.com/yourcelf/occupydatatweets/
Update: Dec 30, 2011 now with all the tweets http://alltheurls.tirl.org/
Update: Dec 12, 2011 you can check the first online mock up with the #occupyboston tweets http://occupybostonlinks.tirl.org

At the Media Lab, after brainstorming various possible projects for the #OccupyData hackathon, we decided to focus on visualizing links sent around via tweets. The following video describes this idea further:

And here’s a picture of the concept from the whiteboard:

twitter links color map

We finished the second night with a working implementation! Screenshot here:

ikytv

Explained:

Source: http://www.ustream.tv/embed/9919272

And here’s the etherpad where we’re documenting the solution:

Continue reading »

Walkthrough of #OccupyResearch Hackathon at the Media Lab

Today Tim McCarthy came by the #OccupyResearch hackathon and shot this short walkthrough of what we’ve been up to. Check it out!

Charlie DeTar on Occupy Streams Map

Video source http://www.ustream.tv/embed/recorded/19034432

One interesting aspect of the Occupy movement has been the widespread use of live streaming to document the camps, actions, and mobilizations in real time using computers, webcams, and cameraphones. On October 24th, I ran across the Occupy Streams site that provides a list of links to all of the livestreams run by Occupiers. I forwarded a link to the site to the general email list used by researchers at the Center for Civic Media:

>> On 10/24/2011 10:36 PM, Sasha Costanza-Chock wrote:
>> Someone make a map, with thumbnails, already 🙂
>> http://occupystreams.org/>>
>> schock

By the next morning, I found this reply in my inbox:

>> > On Tue, Oct 25, 2011 at 7:25 AM, Charlie DeTar wrote:
> ok.
> http://web.media.mit.edu/~cfd/occupystreamsmap/
> http://github.com/yourcelf/occupystreamsmap/
>> -charllie

Later, Charlie DeTar wrote a blog post describing the map that he created. Today, during the #OccupyData hackathon, CDT gave us a more detailed overview of the process he used to code the map. The video at the beginning of this post is a full recording of that overview, shot by Pablo Rey Mazon. Check it out!

Key Links


Continue reading »

BIFI on the 15m


source http://www.ustream.tv/embed/recorded/19030567

Twitter research #spanishrevolution http://15m.bifi.es/

Lecture-talk by “Complex Systems and Networks Group of the Institute for Biocomputation and Physics of Complex Systems at the University of Zaragoza”http://cosnet.bifi.es/

http://15m.bifi.es/index_en.php

#OccupyData brainstorm images

From the first hour of the #OccupyData hackathon!