
This project is basically a free/libre open source implementation of trendistic. We started with the following sketch of Tweet volume by city, displayed in parallel:

Timelines by City
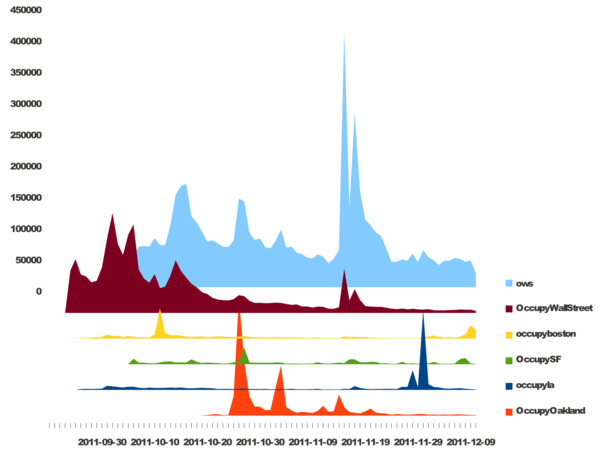
From there, Pablo used inkscape and libreoffice to create the following static mock-up, using the real data from the #OccupyData dataset from r-shief.org
(image pulled from @numeroteca‘s post at https://twitter.com/#!/numeroteca/status/145583946778951680/photo/1)
https://twitter.com/numeroteca/status/145583946778951680/
You can follow our development process on the project’s etherpad below: http://brownbag.me:9001/p/occupyhashtagtimeline
One Response to “Occupy Hashtag Timeline Visualization”
on December 17th, 2011 at 5:11 am #
[…] info about the hackathon and http://bit.ly/occupyhackathon. Category: Front page newspaper analysis 17 December […]